How I Beat the Berlin Rental Market With a Python Script
March 2021
Berlin has a massive undersupply of housing — a widespread phenomenon in western cities.
Usually, this means that prices tend to increase. That’s what used to happen in Berlin too. Then, a couple of years ago, the city municipality passed a controversial rent control policy that prevents price increase for at least 5 years.
It was a very bad idea: the market completely froze and became illiquid.
Housing supply contracted (instead of expanding), due to lack of financial incentives. Those who have a contract do their best to not walk away from it, even when they’d love to.
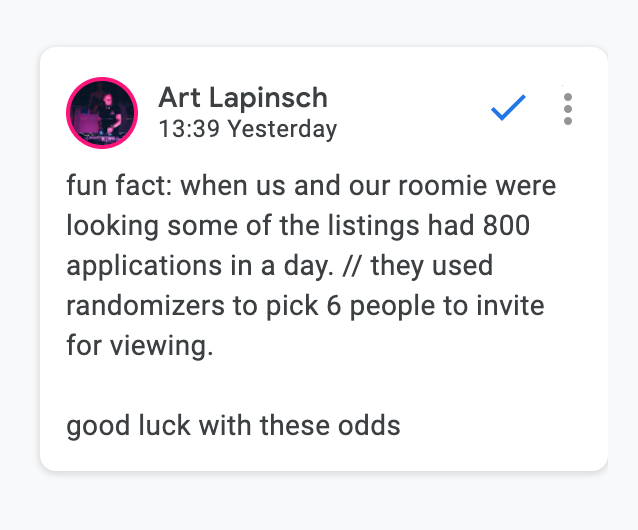
Today, renting in Berlin has little to do with spending power and all to do with competition: you find a rent offer, you visit the apartment with a dozen other people, and you pray that the landlord will select you among everyone else.
There are two elements that influence your ability to be selected and get the contract: your profile, and your speed.
You don’t have much room to change your profile, at least in the short term. Speed, however, is something you can play with.
It’s a trivial strategy: you ask for a visit first, you go to the viewing first, and you apply to get the house first. There’s no guarantee that it will work, but it gives you an edge. Some agencies are pressured to allocate a house in a given timeframe, and might settle for the “good enough”. Others might be inexperienced amateurs that chicken out and just take the first in the queue.
The critical problem of this approach is that you’re effectively making a massive financial decision — up to 50% of your income, for at least 1-2 years — in the span of hours, if not minutes. A big no-no.
To counter this out, you should go to the viewing with your mind already made. However, this is not always easy: it takes many months of experience to start developing an intuition on what price makes sense for a given house. Bargain or FOMO? Hard to tell.
In the mix you should also consider the chance that a rent offer will change price: true, competition is bad, but sometimes landlords misprice their offering and get a group of applicants they judge too small. So they end up lowering the price hoping to attract better candidates.
Finding a great deal is all about waiting if you can afford to do so, and then committing as fast as you can when a good deal is about to go out. Like the stock market.
When I began my hunt, I realized it all came down to quantifying how expensive a house is with respect to similar houses. This is easier said than done. What does “similar house” really mean? It’s more nuanced than just taking the cost of a square meter: a more expensive house might be substantially cheaper when considering its balcony, or its location, or its lack of criminality in the area. It’s a search-optimization problem, but one with quite nebulous variables at play.
I’ll spoiler the end of this story: I ended up being able to find a house I like a lot.
I’m paying less than how the market assesses its value (on average). There were 10 other people during the viewing, but they selected me nonetheless, most likely because I was the first to apply. I literally sent the documentation from the street in front of the apartment, after the viewing.
I was able to do so because I was keenly aware of the specific characteristics of the neighborhood, because the house had changed price twice already (-7% first, and another -6% after that) and was unlikely to change the price again, and because it was very likely to be rented soon. I knew all of this thanks to a couple of predictive models and a few weekends of scraping real estate data.
This is how I did it.
Data architecture
The first thing I needed was the data. I wrote a quick scraper, deployed it on a server, and let it loose. The goal was to build a dataset of all the housing offers in the city: cost, geolocation, and basic parameters describing the properties.
I wanted to move fast and cut corners — this was (supposed to be) a weekend project, not a huge product of sorts. I settled for MongoDB as a database of choice. I’ve read many bad things about Mongo, but the reason why it’s bad is the reason why I liked it: ultra-high flexibility, ultra-low constraints (needed for scale, but hampering speed). I just had to dump some data somewhere: I couldn’t care less about migration and DTO consistency.
I also had no sophisticated chron: it was a Python script constantly running on a tmux pane, connected to a MongoDB Atlas free instance. To that, I only added a Jupyter scratchpad to play with the results.
I was good to go with a weekend of coding. I had my data.
Spatial analysis
In real estate, it’s all about location. What does location mean, though? Is it the postal code? Is it the city neighborhoods? I tried it all. Postal codes lack granularity: they’re too broad and inhomogenous. Neighborhoods are a bit better, but they too are way too broad to allow for precise analysis.
I ended up defining as “region” all the neighborhoods of the city — Prenzlauer Berg, Kreuzberg, Charlottenburg, etc. Then, I iteratively sliced them in half until the resulting cells (that I called “quarters”) weren’t smaller than a 5-minute walking distance from one border to the other.
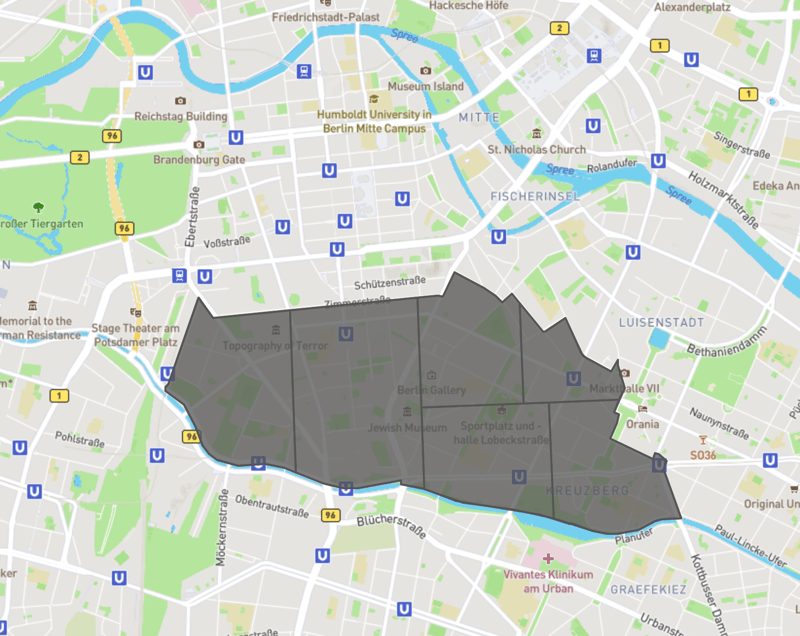
In an ideal world, I should’ve defined these clusters with an unsupervised algorithm (denser regions weighting more), but I lacked enough rental offers to do so, and the historical data I found on all existing buildings was unreliable (it went back to the 70s, before the fall of the Wall: not the best way to describe today’s Berlin).
To store the information, I used GeoJSON. It’s natively supported by Mongo, and being open made it easy to find libraries I could work with.
The trickiest part was computing distances. The distance from point-A to point-B is not a straight line, because they’re on top of a round surface. Luckily, libraries like pyproj and shapely came to the rescue.
I now had my spatial infrastructure too (plus another weekend spent coding).
Features
With information on rents and a neat way to group them in reasonable regions, I then proceeded to add some features to the dataset.
I went on to dump all the data I could. For each region, I created a set of scores and indices describing the quality of public transports, the average density of car-sharing vehicles, safety and criminality, outdoor activities, number and quality of bars and food venues.
I used a host of services to do so. In some instances, I had to produce the data myself (car-sharing and public transports: some good old scraping here too). In other cases, the data was conveniently handed off in public datasets.
After yet another weekend of coding, the result looked like this:
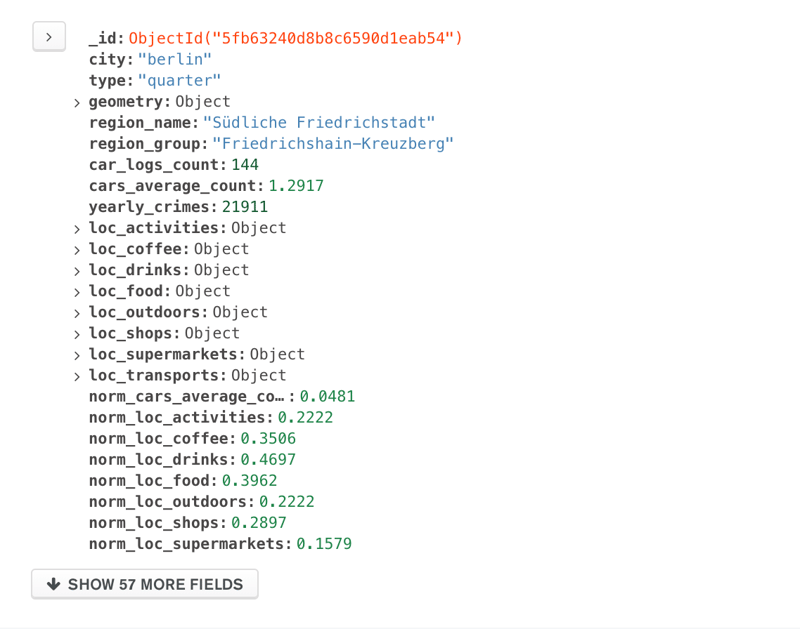
I normalized the scores to make them easily comparable across regions. The outcome was a pretty good map of interesting data I cared about in the city.
Prediction
I was finally ready to put everything together.
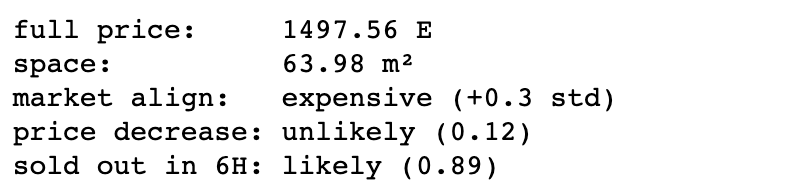
The first number I worked on was a “market alignment” score: how far is the price of a given offer when compared to similar ones on the market? In other words: is it worth the price they’re asking?
To compute the market alignment, I took all the offerings within a radius of 5km from the one being considered. Then, I retained in the pool only those that were:
- Within ±1 standard deviations from the price of the rent, its number of rooms, its living space, and its construction year,
- Within ±1.5 standard deviations from the general characteristics of the region it’s located in,
- Matching the kitchen, garden, balcony, and key-position of the target offer.
This typically kept ~5% of the initial group of offers. It’s possible to play with the numbers — for instance, by increasing the initial radius: more data but potentially less precise. Empirically, this worked out pretty well.
Within this sub-group, I then computed the price per square meter, and saw how far the rent offer was from the mean of the sub-group:
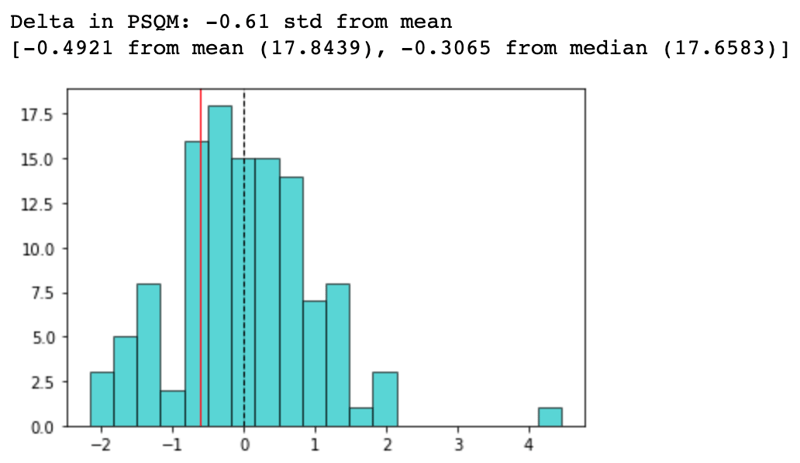
This number was enough for me to have a reasonable idea of what the market considers a “fair price”, versus how the offer was actually priced. In case of a substantially negative delta, I was in for a good deal.
I also computed two more numbers: the likelihood that the rent was about to go sold out soon, and the likelihood of a price decrease.
To get these numbers I trained two supervised models. I fine-tuned the pipeline and hyperparameters with genetic programming on an AWS GPU-heavy machine (still the easiest way to do machine learning, and yet very expensive: there’s so much room for disruption in this space). I didn’t have time to work on the model — again: this was supposedly a weekend project —, so having a machine do the heavy lifting for me, even if less efficiently, was exactly what I needed.
The resulting output looked like this:
Conclusion
I won’t lie, I have the feeling that all this was a bit over-engineered. I found a house I’m super happy with, but maybe there was an easier way to do it. In any case, it was an interesting opportunity to get to know the real estate market in Berlin and to explore technologies I wasn’t familiar with.
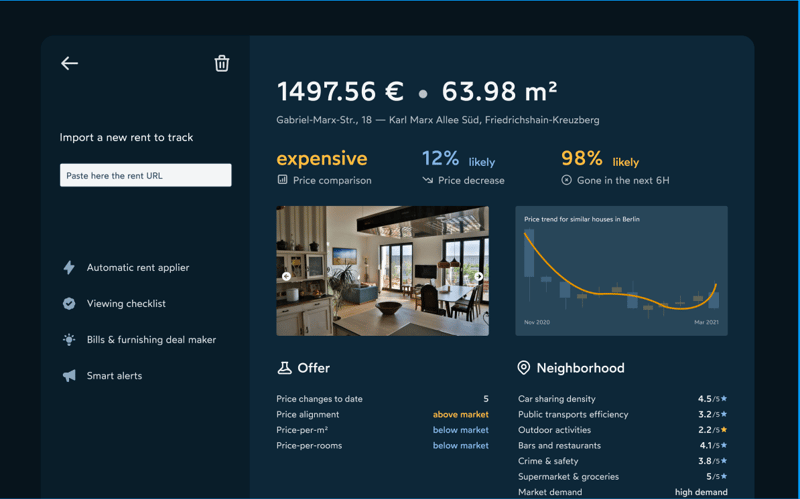
I’m now in the process of turning this work into a web app. Again, a good opportunity to explore technologies and marketing tactics.
I already designed it. It will look like this:
I honestly have no clue if there’s a market for this product. I also don’t know who might be the most efficient demographic to start from as a go-to-market strategy. I’m currently testing a few ideas (rigorously on weekends!), and the initial results are very interesting.
This won’t solve the real estate problem in Berlin. For that there’s one solution only: build more houses. The goal of this tool was (and will be, moving forward) finding great deals at best, and not be screwed over at worst.
There are two main clusters of people I’m thinking of: real estate agents, trying to exploit arbitrage opportunities, and young expats with moderately high spending power (your average developer, for instance) trying to rent consciously.
We’ll see what happens next!
• • •