How to model virality & cohorts in a Financial Plan
January 2020
It's not easy to model virality when planning and projecting startup outcomes.
A few months ago I spent a considerable amount of time trying to find a good template for virality and WOM. The only good ones I could find were from @andrewchen and @rahulvohra, but both so old that the links were broken.
So I wrote down one myself!
What is virality?
First things first. What is virality? A trivial definition can go along the lines of "the more people use the product, the much more people will do the same".
In a more rigorous way, virality consists of a super-linear growth of active users, stacked against a linear (or even sub-linear) growth of marketing spending:
 - Retention: For how long a user will stay active?
Modelling word of mouth (WOM)
Virality starts when someone invites someone else to use a product. Formally, and very dumbly, we can then define virality in this way:
new_users = previous_new_users * 1
That is to say: every single new user will bring a new user with them on board.
In Excel terms, this is to say:
| t | t | t | |
|---|---|---|---|
| Users | 0 | C2 | =C2+D3 |
| New users | 1 | C3 | =C3*1 |
That results in this kind of progression:
| t | t | t | t | t | t | t | ||
|---|---|---|---|---|---|---|---|---|
| Users | 0 | 1 | 2 | 3 | 4 | 5 | 6 | 7 |
| New users | 1 | 1 | 1 | 1 | 1 | 1 | 1 | 1 |
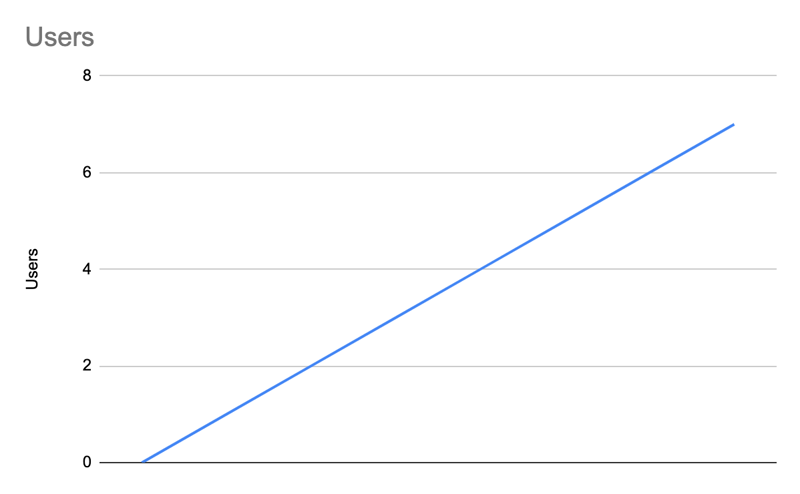
This looks very far from what we'd like to achieve though.
If a new user only invites — on average — a new user, the product will linearly. We need our users to invite, on average, more than one user to the platform if we want to achieve super-linearity.
Let's say, for instance, two each:
new_users = previous_new_users * 2
Which results in this scenario:
| t | t | t | t | t | t | t | ||
|---|---|---|---|---|---|---|---|---|
| Users | 0 | =B2+C3 | 6 | 14 | 30 | 62 | 126 | 254 |
| New users | 1 | =B3*2 | 4 | 8 | 16 | 32 | 64 | 128 |
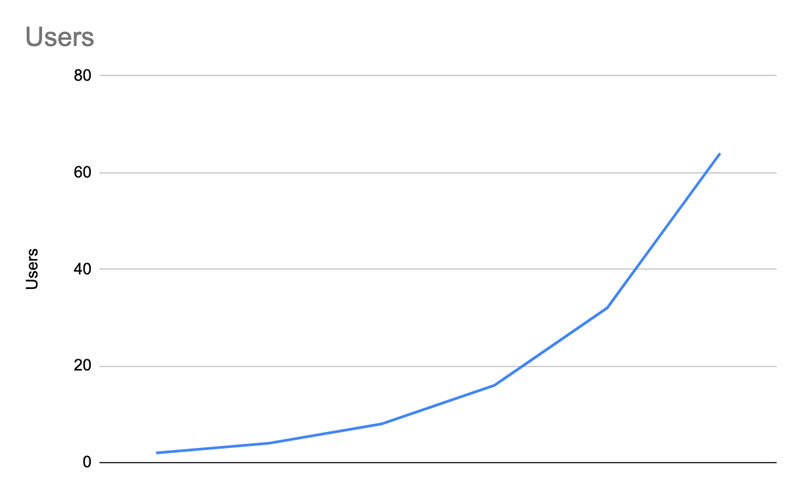
Nice! We're getting there! Now, the issue here is that this model is quite unrealistic:
- First, if
tmeans "month", in roughly 5 years we're going to reach a user-base of 10 quintillion (1e19) people. More or less a billion Earths. - Second, this model doesn't account for retention: not all people will stay in your platform forever!
Evolving the model, part 1: invitation funnel
In the previous paragraph, we saw how we need more than one successful invitation per new user in order to reach superlinear growth. We also saw how 2 invitations are too much. Let's evolve the model by first introducing a funnel:
- Each new user invites 2 users to the platform
- Each invitation has a 70% chance of becoming a successful registration
new_invites = previous_new_users * 2
new_users = new_invites * 0.7
| t | t | t | t | t | t | t | |
|---|---|---|---|---|---|---|---|
| Users | 0 | =B2+B3 | 2.40 | 4.36 | 7.10 | 10.95 | 16.32 |
| New users | 1 | =C4*0.7 | 1.96 | 2.74 | 3.84 | 5.38 | 7.53 |
| Invites | 0 | =B3*2 | 2.80 | 3.92 | 5.49 | 7.68 | 10.76 |
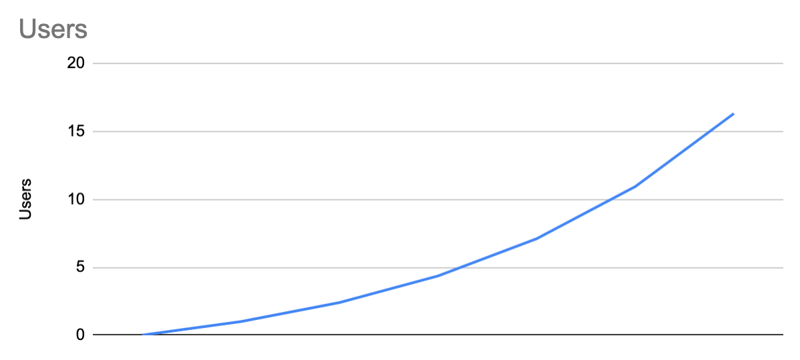
This looks much more realistic. Every 10 users who come on board, 4 new ones will arrive (2 * 0.7 = 1.4). This means that in 5 years we'll have 500M users (1.4 ^ 60 ~ 500M). Still far from reasonable, but in the realm of "it can happen" nonetheless. We're getting close!
Evolving the model, part 2: retention
Now, there's the problem of retention. It's totally nuts to expect every new user to stay with us forever and ever, so we must introduce into this model some kind of churn. A very rudimental modelization of user retention can work like this:
active_users = previous_active_users + new_users - churned_users
churned_users = previous_active_users * (1 - retention_rate)
| t | t | t | t | t | t | t | |
|---|---|---|---|---|---|---|---|
| Users | 0 | =B2+B3 | 2.40 | 4.36 | 7.10 | 10.95 | 16.32 |
| New users | 1 | =C4*0.7 | 1.96 | 2.74 | 3.84 | 5.38 | 7.53 |
| Invites | 0 | =B3*2 | 2.80 | 3.92 | 5.49 | 7.68 | 10.76 |
| Active users | 0 | =B5+B3-B6 | 2.40 | 4.06 | 6.08 | 8.71 | 12.26 |
| Churned users | 0 | =B5*(1-0.7) | 0.30 | 0.72 | 1.22 | 1.83 | 2.61 |
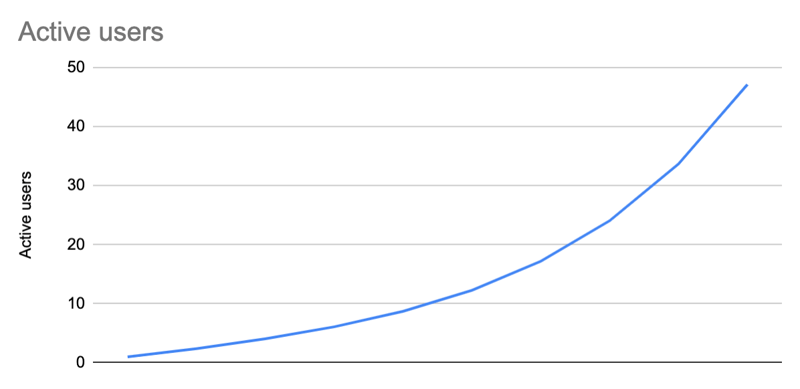
==Growth model with trivial user retention==
Unfortunately, this model is trivial, as it's just leveraging rates. It kinda looks like a Russian roulette:
For any period (say, a month), all the active users have a 30% chance to stop using the product, with no distinction between those who are active since 12 months and those who are active since yesterday.
What can come to the rescue are user cohorts: all the new users acquired in a specific timeframe will "fade" over time, given a specific rate. Let's keep the previous one: 70% retention.
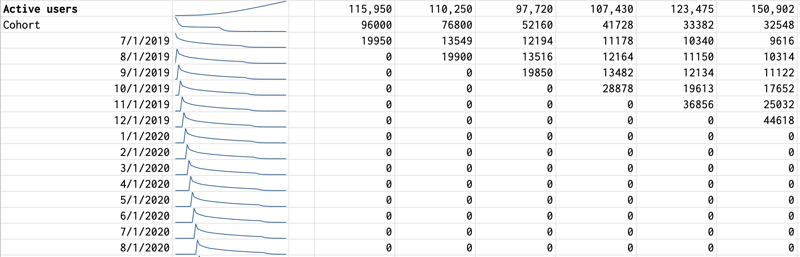
During t1 we get some users. In t2, there will be 70% of them. In t3, 49% (70% times 70%) of them. And so on and so forth:

This makes the retention much more realistic since it becomes a function of time. In the spreadsheet, things start looking a little bit complex though.
| t | t | t | t | t | t | t | t |
|---|---|---|---|---|---|---|---|
| t | { retention_function } | 0.70 | 0.49 | 0.34 | 0.24 | 0.17 | 0.12 |
| t | 0.00 | 1.40 | 0.98 | 0.69 | 0.48 | 0.34 | 0.24 |
| t | 0.00 | 0.00 | 1.96 | 1.37 | 0.96 | 0.67 | 0.47 |
| t | 0.00 | 0.00 | 0.00 | 2.74 | 1.92 | 1.34 | 0.94 |
| t | 0.00 | 0.00 | 0.00 | 0.00 | 3.84 | 2.69 | 1.88 |
| t | 0.00 | 0.00 | 0.00 | 0.00 | 0.00 | 5.38 | 3.76 |
| t | 0.00 | 0.00 | 0.00 | 0.00 | 0.00 | 0.00 | 7.53 |
Every cell of this table has, in it, a "retention function", that looks like this:
=IF (
 $A7=B$1,
 LOOKUP($A7, $1:$1, $3:$3),
 IF(
 INT(RIGHT($A7, 1))>INT(RIGHT(B$1, 1)),
 0,
 A7 * 0.7
 )
)
In plain English: if the cohort I'm currently in (defined row-wise) is equal to the time period I'm currently in (defined column-wise), then define the currently active users as the new users. Otherwise, it's either 0 (because I already have to get there), or 70% of the cohort's active users in the previous period.
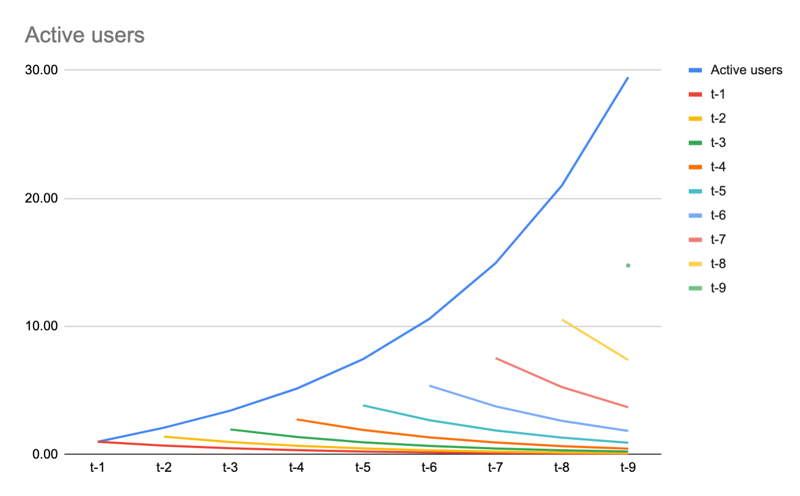
So now, active users are the sum of all the active users for each cohort:
| t | t | t | t | t | t | t | ||||
|---|---|---|---|---|---|---|---|---|---|---|
| Users | 0 | =B2+B3 | 2.40 | 4.36 | 7.10 | 10.95 | 16.32 | |||
| New users | 1 | =C4*0.7 | 1.96 | 2.74 | 3.84 | 5.38 | 7.53 | |||
| Invites | 0 | =B3*2 | 2.80 | 3.92 | 5.49 | 7.68 | 10.76 | |||
| Active users | 1 | =SUM(C7:C) | 2.10 | 3.43 | 5.15 | 7.44 | 10.59 | 14.94 | 21.00 | 29.46 |
Further evolution of the model
There are several things that can be done in order to improve this model.
Search Engine premium
It's possible to introduce a premium for every active user (or every new user) due to an improved organic discovery. It's known that Google and Apple reward products that have a bigger user base, so the bigger you get, the faster the growth should become.
A cliffing user retention
A fixed retention rate for user cohorts doesn't look like truly reasonable. A more realistic approach should be a very high churn after the first period, followed by flat retention for a certain time, later on dropping quite vehemently. For instance: only 40% of people are retained after being acquired. Then, 80% of them stay on board for each period of time, followed by a 15% retention rate from the 13th period onwards.
Flattening word-of-mouth
2 invitations for every new user seems far-fetched as well. It's more likely that the first core early-adopters invite much more than that, like 10-15 each, while the more mature user-base 1.5, or even less. This means that the growth is still super-linear, but decelerating over time.
The role of marketing
Finally, paid marketing can play a huge role in such a model. Having an external factor that increases the number of new users can dramatically accelerate the growth of the whole user-base over time!
The final model
You can fork the final model from this Google Sheet. It's licensed under the GNU General Public License.
• • •